5.2.9 Statistics
The  Statistics tab displays statistics about the sequence(s) being viewed. If only part of the sequence/alignment or assembly is selected then the statistics displayed will correspond to the highlighted part. The length and number of sequences currently selected is shown at the top of the Statistics tab.
Several of the metrics displayed in the Statistics tab can also be displayed as columns in the document table. These include sequence length, % pairwise identity, % identical sites, mean coverage, molecular weight and several protein statistics such as extinction coefficient and isoelectric point. The value in the document table will be for the entire document, not the currently selected region.
Molecular weight and protein statistics were added to the document table in Prime 2021, and will not appear in the table for documents created in an earlier version of Geneious unless that document is edited in Prime 2021. If you wish to add these statistics to the document table for documents created in earlier versions of Geneious, select the folder containing the document and go to Tools → Preferences → Appearance and Behavior and select Recalculate statistics now. Note that for performance reasons these statistics are only calculated on documents comprised of less than 10,000 bp or aa (this threshold applies to the total number of residues and gaps over all sequences in a document).
General statistics
- Residue frequencies: This section lists the residues and their frequencies for both DNA and amino acid sequences, for both single sequences and alignments/assemblies. It gives the frequency of each nucleotide or amino acid over the entire length of the sequence, including gaps. If there are gaps, then a second percentage frequency is calculated ignoring gap characters. The G+C content for nucleotide sequences is shown as well for easy reference (see GC content, below).
- Amino acid and codon frequencies: These are listed for nucleotide sequences based on the current translation options. Click Options to change the translation options. For codon usage statistics, the frequency of all 64 codons (with their associated amino acid) will be displayed. If any CDS contains non-standard start codons then some of the 64 codons may be split into 2 entries based on whether they translate to methionine or their standard translation.
- Amino acid group frequencies: This section list the frequencies of certain types of amino acids as groups. Total frequencies and percentage frequencies of non-gap, non-ambiguous amino acids are given for Acidic (DE), Basic (RHK), Charged (DERHK), Polar Uncharged (NCQSTYW), Hydrophobic (AGILMPVFW), GC-rich (GARP), and AT-rich (FINKY) groups. These groupings were taken from Biochemistry 8th Edition (Berg, Tymoczko, Gatto, and Stryer).
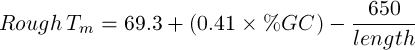
- Rough Tm: A rough calculation of the melting point for a nucleotide sequence using the following calculations:
If the sequence is less than 14bp in length (Marmur and Doty 1962):

|
(5.1) |
If the sequence is greater than 13bp in length (Chester and Marshak 1993):
|
(5.2) |
- Molecular Weight: For protein sequences, the following values are used for the amino acids:
A=71.0788 R=156.1875 N=114.1038 D=115.0886 C=103.1388 E=129.1155 Q=128.1307 G=57.0519 H=137.1411 I=113.1594 L=113.1594 K=128.1741 M=131.1926 F=147.1766 P=97.1167 S=87.0782 T=101.1051 W=186.2132 Y=163.1760 V=99.1326 U=150.0388 O=237.3018
For DNA sequences, the following values are used:
A=313.21 T=304.2 G=329.21 C=289.18
The DNA molecular weight assumes no modification of the terminal groups of the sequence.
If the sequence is a single-stranded, synthesised oligonucleotide (e.g. by primer extension), the value is adjusted for the removed phosphate group by using:
Molecular Weight = calculated molecular weight - 61.96
If the sequence is a single-stranded sequence cut by a restriction enzyme, the value is adjusted for the extra 5′-monophosphate left by most restriction enzymes by using:
Molecular Weight = calculated molecular weight - 61.96 + 79.0
For dsDNA, these values are adjusted for both strands.
For RNA sequences, the following values are used:
A=329.21 U=306.2 G=345.21 C=305.18
The RNA molecular weight assumes no modification of the terminal groups of the sequence. For a 5′-triphosphate group, weights are adjusted using
Molecular Weight = calculated molecular weight + 159.0
- Isoelectric Point: Calculates the isoelectric point of a protein using the bisection method described at isoelectric.org. Amino acid pKa values were taken from the CRC Handbook of Chemistry and Physics 90th Edition, with general pKa values for terminal amino and carboxy groups taken from Biochemistry 8th Edition (Berg, Tymoczko, Gatto, and Stryer).
- Charge at pH 7: Estimates the overall charge of a protein at pH 7.0 using methods described at isoelectric.org. Amino acid pKa values were taken from the CRC Handbook of Chemistry and Physics 90th Edition, with general pKa values for terminal amino and carboxy groups taken from Biochemistry 8th Edition (Berg, Tymoczko, Gatto, and Stryer).
- Extinction Coefficient: Calculates the extinction coefficient of a protein as per Gill and Hippel, 1989, using the following values for the amino acids and assuming all cysteines are paired in a disulfide bridge (making cystine): C=62.5 (only counting up to an even number) W=5500 Y=1490
- A[280] of 1 mg/ml: The correction factor at 280nm, calculated by dividing the extinction coefficient by the molecular weight.
Statistics for multiple sequences (lists, alignments, assemblies)
- Sequences: The number of sequences in the document, or in the currently selected region.
- Identical sites. When viewing alignments or assemblies this considers only those columns in the alignment that have at least 2 nucleotides/amino acids/gaps that are not free end gaps and are not columns consisting entirely of gaps. A column not meeting this requirement is not even counted as non-identical for the percentage calculation. A column meeting this requirement is considered identical if it contains no internal gaps and all the nucleotides/amino acids are identical. Ambiguity characters are not interpreted, so a nucleotide column of A and R is not considered identical.
- Pairwise % Identity. When viewing alignments or assemblies this gives the average percent identity over the alignment. This is computed by looking at all pairs of bases at the same column and scoring a hit (one) when they are identical, divided by the total number of pairs. Ambiguity characters are interpreted, meaning a nucleotide A vs a nucleotide R is considered to have 50% identity.
For both Identical sites and Pairwise % Identity, the statistics are calculated from the subset of sequences and nucleotides/amino acids selected. If just a single sequence is selected, the statistics are calculated as if all sequences are selected over the selected columns. The consensus sequence is always excluded from calculation of both of these values.
- Coverage of Bases. When viewing a contig assembly this gives the mean, standard deviation, minimum and maximum of the coverage of each base in the consensus sequence. For small contigs the coverage is further broken down into coverage by reads mapped to the forward and reverse strands. For large contigs, separate forward/reverse coverage can’t be efficiently calculated, so is displayed as ?. If your contig has a reference sequence, then the percentage of the ungapped reference sequence that is covered by at least 1 read is also displayed.
Selecting a sub-region of your contig will display statistics for just that region, including calculation of separate forward/reverse coverage on large contigs.
For contigs where reads extend outside the bounds of the reference sequence, the document table mean coverage is calculated excluding regions outside the reference sequence. The mean coverage displayed in the contig viewer statistics in this same situation when nothing is selected includes regions outside the reference sequence. Click on the name of the reference sequence to select just that region in order to display detailed coverage statistics over just the region spanned by the reference sequence.
- [Ungapped] Lengths of Sequences. Displays the mean, standard deviation, minimum and maximum of the lengths of the sequences.
- Confidence (mean). When viewing sequences containing quality scores (e.g. chromatograms or NGS reads) this gives the mean of the confidence scores for the currently selected base calls. Confidence scores are provided by the base calling program (not Geneious) and give a measure of quality (higher means a base call is more likely to be correct). An untrimmed value is also displayed if the selected region contains trims.
- Expected Errors. When viewing sequences containing quality scores, this gives the approximate number of errors that are statistically expected in the currently selected region. This is calculated by converting the confidence score for each base call to the error probability using the formula 10(−Q∕10). For example, a base with a quality score of 30 will have an error probability of 0.001. The expected errors value is then calculated by summing up the error rates for each base. This also has a value for the untrimmed selection if the region contains trims.
GC content
For documents that are created or modified in Geneious 8.1 or later, the GC content can also be viewed in the %GC column in the document table.
The %GC column shows the percentage of A, C, G, T, U, S, W nucleotides that are either G, C, or S. Ambiguous bases that contain a mixture of GC and non-GC bases (e.g. R, Y, M, K) are excluded from the calculation. This field is available on all nucleotide sequences, contigs, alignments, and sequence lists that were created or had their sequences last modified in Geneious 8.1 or later. For contigs and alignments, the consensus sequence and reference sequence (if any) are excluded from the calculation.
For sequences within an alignment, contig or list, the %GC column only shows the overall value for the alignment. To see a table of GC percentages for all individual sequences within an alignment or contig, the sequences need to be extracted to stand-alone sequences. Alternatively, individual values can be viewed in the statistics panel by clicking on the name of the sequence to select it.
Sequences in a list or alignment can be sorted by GC content by right clicking in the sequence viewer and choosing Sort → %GC.