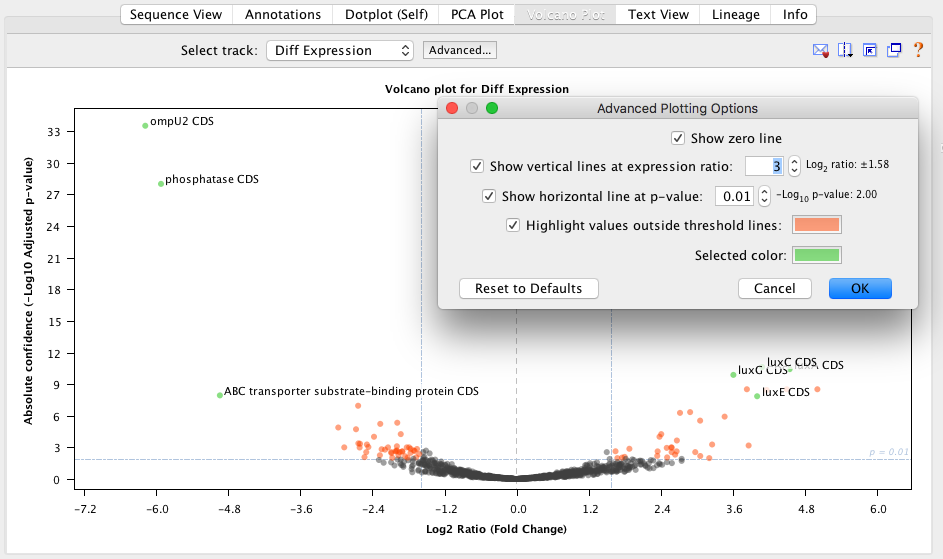
Figure 11.3:
Volcano Plot viewer showing the Advanced options along with some selected outliers.
The Volcano Plot allows you to see the most highly differentially expressed loci. This is automatically generated when you compare expression levels using either Geneious or DESeq2. This plot will be available to view in the Volcano Plot viewer (Figure 11.3 ) once you have saved the newly-generated differential expression sequence track to your document. If you have multiple differential expression tracks from running more than one analysis, you will have the option to select which track you’d like to show in the Volcano Plot viewer.
The Volcano Plot shows the fold change (log2 Ratio) plotted against the Absolute Confidence (-log10 adjusted p value). Each dot on the plot is one gene, and the “outliers” on this graph represent the most highly differentially expressed genes. To see the gene represented by each dot, mouse over the dot. Click the dot to select it and display the gene name on the graph. The dots on the Volcano plot are linked with both the annotations table and the annotations in the sequence viewer. Thus, if a locus is selected on the Volcano Plot, it will also be selected in the annotations table and the sequence viewer.
The Volcano Plot can be configured by clicking the Advanced button. Here you will find the following options: