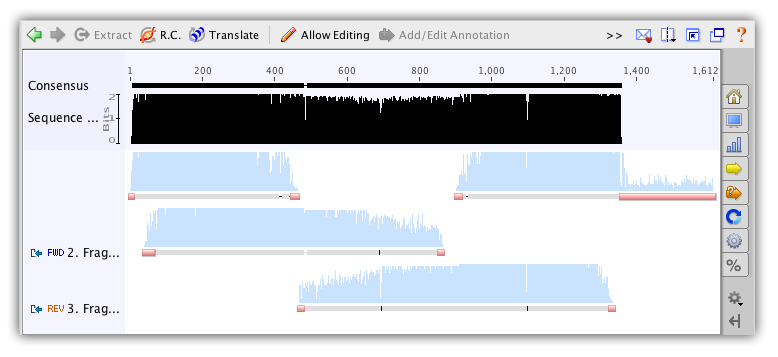
10.5 Viewing Contigs
Contigs in Geneious Prime are viewed (and edited) in exactly the same way as alignments. There are several features in the sequence viewer which are worth taking special note of when viewing contigs:
- The consensus sequence is normally of particular interest and this is always displayed at the top of the sequence view (labeled Consensus).
- When all sequences in a contig (or alignment) have quality information attached then you can select the Highest Quality consensus type. This almost removes the need for manually editing the contig because this consensus chooses the base with the highest total quality at each position. See section 9.5
for more information on how this is calculated.
- There is a Base Call Quality color scheme which is selected by default for alignments of all chromatograms. This assigns a shade of blue to each base based on its quality. Dark blue for confidence < 20, blue for 20 - 40 and light blue for > 40. The consensus is also colored with this scheme where the confidence of a given base in the consensus is equal to the maximum confidence from the bases at that site in the alignment.
- There is a Mapping Quality color scheme for reads mapped to a reference sequence. A mapping quality represents the confidence that the read has been mapped to the correct location. For a read with mapping quality Q, the probability that it has been incorrectly mapped is 10(−Q∕10). For example, a read with a mapping quality score of 20 has a 1% chance of having been incorrectly mapped. Reads that could be mapped to multiple locations will have a maximum mapping quality score of 3, which indicates it had at least a 50% probability of mapping elsewhere. Mapping qualities have a maximum value of 254 for consistency with the SAM/BAM format. If a sequence has no mapping quality (i.e the document was produced in a version of Geneious prior to 8.1 or imported from a SAM/BAM file that didn’t have mapping quality) then it will be colored gray. Mapping quality for the sequence under the mouse is also displayed in the status bar. All mappers use heuristics to calculate mapping qualities. For unpaired reads, the Geneious mapper assigns a mapping quality of 20*(the number of additional mismatches in the second best location the read maps to). For paired reads the individual unpaired mapping qualities are calculated, but these are increased by up to 20 depending on how close the best pair is to the expected insert distance compared with the second best pair.
- The sequence logo graph has an option to “Weight by quality”. This is very useful for identifying low quality regions and resolving conflicts.
Finding regions of low/high coverage
In addition to the coverage graph which gives you a quick overview of coverage, under the Annotate & Predict toolbar is the Find Low/High Coverage feature. This feature annotates all regions of low/high coverage which you can then navigate through using the little left and right arrows next to the coverage annotations in the controls on the right. You can set the threshold low/high coverage by either specifying an absolute number of sequences or a number of standard deviations from the mean coverage.
The find low/high coverage tool can also be used to record the minimum, mean, and maximum coverage of each annotation of a particular type on the reference sequence. To do this, in the Only Find In section of the options, turn on Annotations in reference sequence of type and choose Create annotations of same type on reference sequence.
Viewing Contigs of Paired Reads
In order to view a contig of paired reads, you first need to have set up the paired data before assembling - see 10.2.1
. Once you have your paired read assembly, the contig viewer adds an option to Link paired reads in the advanced section of the controls on the right. This means that pairs of reads will be laid out in the same row with a horizontal line connecting them. Reads separated by more than 3 times their expected distance are not linked by default unless the Link distant reads setting is turned on.
The horizontal line between paired reads is colored according to how close the separation between the reads is to their expected separation. Green indicates they are correct, yellow and blue indicate under or over their expected separation and red indicates the reads are incorrectly orientated.
The reads themselves can also be configured to be colored in this way if you use the Paired Distance color scheme from the general (top section in the controls on the right) settings. The colors used and the sensitivity for deciding if reads are close enough to their expected distance can be configured from the Options link when the Paired Distance color scheme is selected.
You can hover the mouse of any read in a contig and the status bar will indicate the expect separation and expected separation between the reads.
